
Discussion: Chronological Plots
We selected specimens for analysis according to the following criteria in order to illustrate changes in papermaking materials and techniques over time.
-
Specimens should be evenly distributed by
- country (of original paper mill),
- date (of writing or printing),
- quality (of materials and workmanship),
- book sizes (i.e., not all folios).
- Specimens should have been stored, on average, in similar conditions.
- Specimens should be in original bindings or other evidence should confirm that there is no history of “aqueous intervention,” such as washing or resizing.
These idealized parameters, in fact, would be difficult to attain. Approximately 4,000 specimens were considered during the initial stages of this study. Roughly 2,440 specimens were rejected and 1,578 specimens selected for analysis. As we acknowledge in the PROCEDURES section, specimens selected for this project were not evenly distributed as outlined above. Considerably more staff and time would have been necessary to assemble such a specimen set. Even if the effort had been expended, we would still have faced the reality of significantly different paper and book production rates in different countries at different times.
Item 2 above is especially troublesome because some books have always been more prized and have therefore almost certainly received better care. The prime examples are incunabula and manuscript books. Thus the collecting and care habits of private individuals and institutions represent unavoidable additional biases. Nevertheless, we feel our plots across time can be of use in understanding changes in papermaking materials and technique if those apparent changes or trends can later be substantiated with different approaches to analysis of the data. With this caveat, we discuss the following plots.
Gelatin, calcium, paper thickness, color
Plot 1, Plot 2, Plot 7, and Plot 8 show gelatin and calcium concentration, and paper thickness by year. In each plot the variable decreases across the centuries with a noticeable change apparent around 1500. On the Delta L* scale from white to black in plot 9 the mean values start out light, become darker, and then lighter again but they never attain the lighter fifteenth-century values until the invention of chlorine bleach around 1800. Thus we see similar trends in four variables measured with three different instruments.
If we assume that these trends do indeed represent changes in the craft that took place across Europe, what historical events would explain them?
We would offer that early printers were, by their type designs, and with hand-rubricated letters, endeavoring to print and sell imitation hand-copied manuscript books. Printers likely made this effort because manuscript books—the better of which were on parchment—were the only models at the time for how a book should appear, feel, and function in the hands. Up until the turn of the sixteenth century, and even beyond, bookbinders also continued to design books that evoked monastic wooden-board structures. In this atmosphere, we believe it is plausible that papermakers of the period were attempting to make, not paper per se, but essentially a form of imitation parchment.
Paper of that era, made from old, well-worn linen and hempen rags, was rather weak, soft, and absorbent after drying. But the application of gelatin size, followed by burnishing with a polished stone, transformed it into a very believable substitute for parchment: tough, abrasion resistant, smooth, and able to accept ink without bleeding. Calcium was a key ingredient in making parchment. According to fifteenth- and seventeenth-century accounts, lime was used during beating, probably to help facilitate maceration of the rags by swelling the fiber.1 Calcium compounds almost certainly also served to help lighten the color of finished paper or parchment. Thicker paper tends to be stronger.The rapid spread of printing and the demand for books could indeed have changed all this around 1500. The quickest way for papermakers to lower the price per sheet is simply to make their paper thinner. Cutting back on other ingredients, such as calcium compounds and gelatin, would have also helped lower expenses and therefore the price of the finished paper.
With regard to the decline in gelatin addition, we need to remember that early printers were effectively printing on writing paper—the only paper available at the time for books and a material designed to properly receive water-based inks and paints. The printers, who were using oil-based inks, had trouble with it. The ink sat on top of the paper and squeezed out under the typefaces, leaving a less than sharp imprint. Dampening the paper prior to printing became standard operating procedure and helped a great deal, but it was an added step. And the more size in the paper, the longer the step took. J. A. Szirmai argues that by the late fifteenth century papermakers were in fact supplying completely unsized paper to the printers, and it was the binders who applied the size later.2 Papermakers would have welcomed the request to supply paper without the need for the laborious and troublesome sizing step. Bookbinders may have taken on this added step because the paper was otherwise too weak to withstand binding and end use by readers. Being able to write in the margins of a book without ink bleeding may have also been an expected end use for many readers.3
While this view constitutes a plausible historical scenario that can explain the trends we see in the chronological plots, in reality we are probably looking at a combination of actual significant changes in papermaking around 1500 and the influence of the biases in specimen selection, collection, and care habits over the centuries, etc., that we have discussed above.
What other historical evidence might support the idea that fifteenth-century papermakers intended to produce an outright substitute for parchment? Format, or paper size, is one possibility. The image below, cited by Charles Moïse Briquet, is an inscription in limestone in Bologna, the text for which dates from 1389.4 It reads “These are to be the moulds of the city of Bologna, which say what the sizes of the sheets of cotton paper must be, which are made in Bologna and the surrounding area, as is set out here below.”5
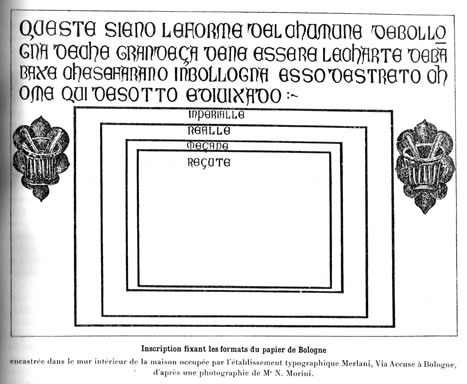
We ignore for the moment the inaccuracy of the mention of “cotton” paper, as the raw material of the era and for much of the history of the craft in Europe was linen and hempen rags. We note instead that the dimensions shown, which range from about 12½ by 18 inches to 20 by 29 inches, all have a short-dimension divided by long-dimension ratio of about 0.7. Considering the ratio rather than the exact sheet size has the advantage of minimizing the impact of changes in actual sheet dimensions due to shrinkage during drying or sheet-edge trimming during binding. In other words, if the sheet we are considering is actually smaller than the original deckle dimensions, the amount of difference is likely to be proportionally the same in long and short dimensions, and therefore the ratio is likely to stay the same.
But where did the Italians come up with the Bologna sizes and this ratio? Perhaps from Arab papermakers who worked in the Mediterranean area before them. Indeed, in Josef von Karabacek’s 1887 endnotes on Arab paper sizes, he cites a range of small early tenth-century paper sizes to larger early fifteenth-century sizes.6 Their ratios are very close to those for the early Italian papers.
The dimensions in centimeters from the Bologna inscription and the corresponding ratios are shown in the upper left of the table below. Dimensions shown in red indicate where we have halved a sheet on one side of the table to match a size on the other. The average Italian ratio at the bottom of the table, 0.71, is very close to the average Arab ratio of 0.70.
MATCHES IN ITALIAN (1389) AND ARAB (10th-15th C.) PAPER SIZES OBTAINED BY CALCULATING HALF-SHEET DIMENSIONS
T. Barrett, February 6, 2010
Ratio = short dimension divided by long dimension
Italian paper dimensions7 (cm) |
Name |
Ratio |
Arab paper dimensions8 (cm) |
Arab paper date and/or name |
Ratio |
45 x 32 |
Recute (small) |
0.71 |
|||
52 x 35 |
Mecane (medium) |
0.68 |
|||
62 x 45 |
Realle |
0.73 |
|||
74 x 51 |
Imperialle |
0.69 |
|||
32 x 23 |
Half Recute |
0.72 |
32 x 24 |
10th C, Sulayman paper |
0.75 |
88 x 62 |
1337 Damascus |
0.71 |
|||
62 x 45 |
Realle |
0.73 |
62 x 44 |
Half 1337 Damascus |
0.71 |
95 by 66 |
1306, Khan Uljaytu Koran |
0.70 |
|||
62 x 45 |
Realle |
0.73 |
66 x 48 |
Half 1306, Khan Uljaytu Koran |
0.73 |
110 x 73 |
Baghdad whole sheet |
0.67 |
|||
74 x 51 |
Imperialle |
0.69 |
73 x 49 (or 73 x 55) |
Baghdad half sheet |
0.67 |
110 x 73 |
Complete Tumar |
0.67 |
|||
74 x 51 |
Imperialle |
0.69 |
73 x 49 |
Complete Mansur |
0.67 |
32 x 23 |
Half Recute |
0.72 |
37 x 24 |
Half Mansur |
0.65 |
18 x 12 |
Quarter Mansur |
0.67 |
|||
Average |
0.71 |
Average |
0.70 |
But where did Arab papermakers get the ratio? It turns out that it is very close to the 0.71 ratios for the largest possible rectangles of useable skin available from the back of a goat, sheep or calf when making parchment.9 This ratio (which J. Peter Gumbert calls “invariant” in manuscript book studies) stays the same when cutting down to two half sheets from the full, or quarter sheets from the halves, etc.
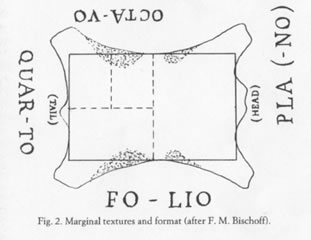
Image from J. Peter Gumbert, “Sizes and Formats.”10
In northern Africa, parchment and paper were both in use during the same time period for copying the Koran and for other applications.11 This, along with the almost identical format ratios suggests that Arab paper sizes were indeed influenced by parchment sizes. See Neil Harris's “Shape of Paper” for an overview of medieval paper formats, including an excellent extension of the present discussion on the interplay between parchment and paper sizes.12
In summary, we feel confident that fourteenth- and fifteenth-century European papermakers ordered moulds in sizes intended to produce paper that would match the dimensions of the competing parchment material.13 We also believe our plots indicate other characteristics of the sheets were enhanced to yield a parchment-like look and feel in the finished paper and that this, in turn, can help explain the unusual aesthetic and physical properties of paper from the period.
Alum and calcium carbonate
Alum of the period was potassium aluminum sulfate. Papermaker’s alum, aluminum sulfate, did not become common until the nineteenth century according to Irene Brückle.14 The two compounds were almost certainly used, perhaps for different applications, after 1800. We were unable to obtain a useful XRF calibration for aluminum, primarily because of reduced instrument sensitivity to the lighter elements. Therefore, to investigate alum concentration, our available K and S values are of immediate interest. We believe there is evidence in our data that K and S appeared in the specimens we analyzed primarily as elements in alum as a result of the trend shown in plot 6, Log S vs Log K by century. In this series of related plots, it seems clear that as the concentration of S went up, so too did the concentration of K. We note that this repeated semilinear relationship between K and S becomes less apparent in the nineteenth century, when aluminum sulfate replaced, or began to replace potassium aluminum sulfate in paper mills. The individual trends for Log K and Log S by Year can be seen in plots 3 and 4 respectively. The almost flat trends contradict the Barrow lab plot below that appears to show an increasing trend for alum over the centuries.15
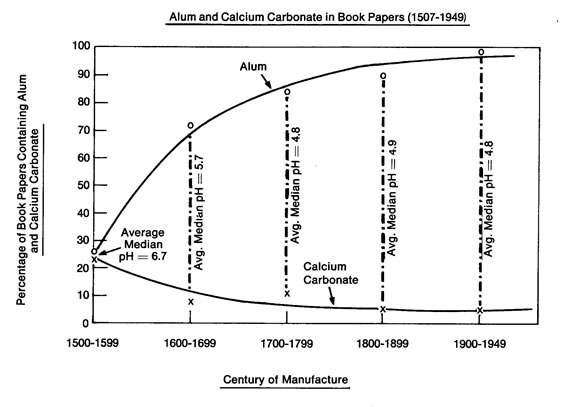
We note however that the Barrow plot does not display the amounts of alum and calcium carbonate in paper but rather the percentage of papers containing those compounds. The Barrow workers used a spot indicator and recorded a positive or negative reaction for alum and calcium carbonate on each book tested. The plots in our work display actual concentrations.
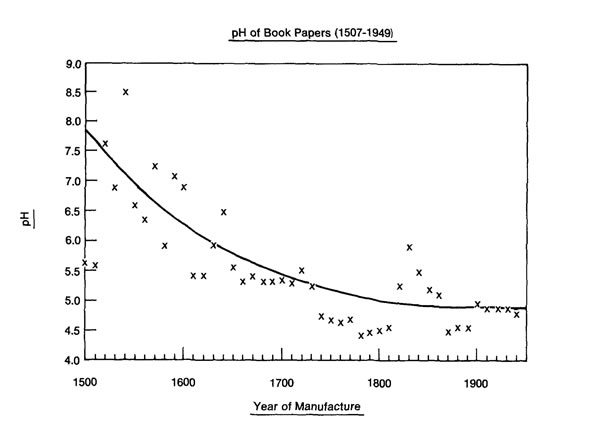
When considering the related Barrow plot for pH above, many have mentally combined it with the previous plot and continued to assume more alum was being added over the centuries because the pH does go down, and it goes down significantly.
Interestingly, in a comparison of surface pH to ppm values for Ca in 120 historical papers, Timothy Barrett et al. found that in papers with 3000 ppm Ca or less the pH was 6.5 or less with most points falling closer to 4.5.16 For papers with a Ca content of 4000 ppm or more, the pH was 6.0–9.4. Papers with values between 3000 and 4000 ppm Ca showed a pH range of 4.2–7.2. Based on these parameters, the 7,500–12,000 ppm values for Ca found in the fifteenth century during this study (plot 12e) suggest an alkaline or near neutral pH prior to 1500, with a subsequent decline over the centuries similar to that seen in the Barrow plot above.
As a result of this work we believe these declines in pH were not a result of increasing alum concentrations but rather of declines in concentrations of gelatin and Ca compounds (plots 1 and 2). Calcium carbonate is a common alkaline reserve added to modern papers designed for archival applications to counter acidic compounds that may be in the paper or may enter it in the future. John Baty and Timothy Barrett demonstrated that gelatin can make a contribution to paper stability by acting as a pH buffer.17
An actual calculation of the hypothetical weight percent alum and calcium carbonate concentrations from the ppm data is possible. This is problematic however because the sources of K, S, and Ca are unknown. They likely included the water used in papermaking, wood ash lye soaps used in washing the fabric that became rags, the original raw fiber in the rags, or other sources in addition to alum or calcium carbonate actually added by the papermaker. The calcium compound added during papermaking might have been slaked lime (calcium hydroxide: Ca(OH)2), rather than chalk or calcium carbonate, but for our purposes here we assume any Ca(OH)2 added has converted to CaCO3 over time.
While we make the assumption with reservations-- that all K and S are associated with alum, and that all Ca is associated with calcium carbonate --the resulting weight percent configuration of the data after conversion is the most straightforward means of comparing possible historical application rates, to application rates used in the production of modern handmade and machine-made papers intended for archival or conservation uses. For example, many standards for long lasting machine-made papers call for addition of an alkaline reserve such as calcium carbonate at a minimum of 2% of the weight of the finished paper.18
In plot 12 we see the theoretical calcium carbonate content vs year. It is evident that the pre-1500 papers contained on average 1.5-2% while papers in subsequent centuries averaged about half that amount, or 0.75%
Weight percent alum concentration based on S by year is shown in plot 13. The trend is flat and similar to that in plots 3 and 4. Plots 14, 14a, and 14b show similar plots using K, again with a more or less flat trend. Again, we decided to assume potassium aluminum sulfate use prior to 1800 and aluminum sulphate use after 1800 for plotting purposes, however the decision is somewhat arbitrary as the two compounds were almost certainly used for many generations after the introduction of aluminum sulfate around 1800.
We made our calculations for generating the weight percent alum and calcium carbonate data from the ppm data available. Note that we assumed a varying number of water molecules remain attached to each alum molecule when making these calculations.
The plotting of alum concentration is more complicated. Alum was added to gelatin sizing solutions, we believe, to help harden the gelatin, to improve its resistance to aqueous media, or perhaps to help preserve the solution for more extended use. In preparing gelatin- sized laboratory specimens for accelerated aging studies Anne-Laurence Dupont found that solutions ranging from about 0.85% to 3.5% gave gelatin concentrations in the finished papers between 2% and 8%.19 Historical solution concentrations likely ranged from 0% to 4% to yield the 0% to10% and higher gelatin concentrations we observed in the finished papers in plot 1.
Modern papermakers commonly prepare gelatin size beginning with a solution made from dry gelatin and water. Alum is then added based on the weight of the dry gelatin. If a papermaker prepares a 3% gelatin solution with alum added at “5% alum on gelatin,” (mass alum /mass gelatin), then 10 liters of the size requires 300 grams of dry gelatin and 15 grams of alum. The math would be 300 × .05 = 15 or 15/300 = .05. Multiplying .05 by 100 gives us the 5% figure. Irene Brückle found that alum added at 1% alum on gelatin did not negatively impact the strength of gelatin sized paper after accelerated aging.20 Historical alum concentrations may have been as high as 30% alum on gelatin (100 × mass alum/mass gelatin).21
Reconstruction of historical gelatin-sizing formulas is not easy, in large part because the concentrations of historical gelatin solutions are unknown to us. This is due to the fact that, for much of the history of the craft, the gelatin solution was prepared straight from animal hooves, hide bits, parchment clippings etc. rather than from prepared dry gelatin. But if we leave aside the question of gelatin solution concentration for the moment, the ppm data gathered in this work, and the conversions to weight percent alum along with the weight percent gelatin data allow us to reconstruct the percent alum on gelatin rates used historically. See plots 15 and 15a where these percentages are shown by year. It is evident that before 1500 papermakers used lower percentages of alum on gelatin. After 1500 the percentages at least doubled. Before 1500 the average was 12.6% and after, 29.3%; the median before was 8.7% and after, 17.6%. There are two possible explanations for this: 1) more alum in the size solution lessened the concentration of actual gelatin in solution that had to be prepared for effective sizing in the finished paper and 2) adding more alum extended the useful life of a size solution that would otherwise spoil.
During a study of gelatin-sized papers exposed to accelerated aging Dupont found there was no degradation of the gelatin polymer at alum on gelatin application rates of 10% or less.22 Interestingly, this corresponds to the about 10% alum on gelatin rate before 1500 that we found in our work (plot 15a).
In summary, it is not the concentration of alum alone that is of primary interest, rather it is the alum concentration relative to the concentration of gelatin or calcium carbonate because the latter two can mitigate the acidic nature of alum. Therefore, in Plot 16 and Plot 16a we see the percentage of alum on CaCO3 graphed, although the alum almost certainly was added based on the gelatin concentration, not on that of the calcium carbonate. The papermaker may not have even known the level of lime or chalk in the paper. On average, the pre-1500 percentage of alum on CaCO3 is at least double the post-1500 figure. Before 1500 the average was 230%, and after 110%; the median before was 156%, and after 55%. This, on the face of it, would indicate a potentially lower pH pre- versus post-1500. However, we note that the alum on gelatin values cited above are just the opposite, pre-1500 versus post-1500. Furthermore, the concentrations of gelatin in paper were much higher than those for CaCO3 as shown in plots 1 and 12. The net pH was likely near neutral or alkaline but other than the ppm Ca to surface pH relationship mentioned above, we have no data to support the supposition.23
Ratio of gelatin to calcium carbonate
Plots 12b, 12c and 12d show the ratio of weight percent gelatin to weight percent CaCO3 . These plots indicate more gelatin was being added relative to CaCO3 prior to 1500. The average before 1500 is 19.8, after 4.5. The median before 1500 is 17.6, after 2.5. It is unknown whether the decrease in this ratio results in less net stability compared with decreases in gelatin or CaCO3 alone.
This shift in ratio argues against the idea that Ca entered paper primarily as a result of limed skins and other animal parts used to make the gelatin size. If that were the case, the ratio between the two would stay more or less the same across the centuries. Interestingly, when all the data is pooled as it is in plot 44, we do see a positive association between gelatin and Ca: as Log Ca increases, gelatin concentration also increases. Gelatin size materials and preparation methods could be responsible for the change in ratio. For instance, it may be that during the fifteenth century fresher (more lime-free) animal parts, or more thoroughly washed limed skins and parchment clippings were used when preparing size solution. This could result in a higher gelatin to CaCO3 ratio.
Iron
Plot 5 Log Fe by Year shows an almost flat trend, particularly when the significance tabletops at the top of the plot are considered. Interesting additional plotting analyses of the Fe data follow below under Nonchronological Plots.
Chlorine peak
One of the surprises during specimen analyses was an occasional noticeable peak for Cl. We did not expect Cl in significant amounts so it was not included in our calibration work; however plot 10 shows the relative peak intensities. (The black line is the moving average with a period of 25, which gives an indication of trends by smoothing out the data. It begins by taking the average of the first 25 points then we step to the right one point and calculate the average of that reading and the previous 24, and we continue stepping to the right point by point through the rest of the data in the same fashion.) Our primary suspicion for a source of Cl is human sweat, however the locations of Cl peaks were not associated with areas of book leaves showing signs of significant handling. Aqueous Cl based bleach treatments are another possibility but as mentioned earlier, any specimens showing noticeable evidence of wet treatment of any kind were not included in the study. The source of these Cl peaks remains unknown.
Leaf types
As discussed under PROCEDURES, specimens selected for analysis included manuscript leaves and books, printed leaves and books, art prints, and blank leaves. Plots 98 through 102e give an interesting picture across the time line of differing ingredient formulations for these paper types. The bar graphs in this group are especially helpful in summarizing the findings: Plot 102e shows noticeably higher levels of gelatin in manuscript leaves and manuscript books. This is not a surprise if we assume the papermaker clearly designed the paper for use in writing. More interestingly, plot 98d for calcium shows similarly high levels for both manuscript leaves and books. Calcium compounds were essential in parchment production, and they therefore may have been utilized in higher amounts when making papers intended to substitute for parchment.
K and S concentrations are more or less even across leaf types (plots 99a and 100a) with the exception of eight blank leaves tested which were higher. Fe (plot 101a) was flat across leaf types.
It is important to emphasize once again the potential pitfalls of chronological plots. For instance, in the plots discussed so far there is an apparent association between paper that is lighter in color and thicker and higher levels of calcium and gelatin. These papers tend to be from before the fifteenth century. But this observation could in large part result from excellent storage conditions for the pre-fifteenth-century papers and much poorer treatment of the specimens tested from subsequent centuries. Similar biases may be at play in the Barrow chronological plots. The drop in pH observed by the Barrow team may be related more to differences between the sixteenth-century gelatin-sized European handmade papers and the twentieth-century American machine-made papers they tested than it is indicative of a gradual trend in papermaking across the centuries worldwide. To minimize the effects of this problem, in the following nonchronological plots we pooled all the data, regardless of year, in an attempt to find trends that support or contradict those seen in the chronological plots.
[1] Dabrowski and Simmons cite Francesco Maria Grapaldo’s 1492 brief but tantalizing description of early Italian papermaking and the addition of lime to the stamper pits. Jozef Drabrowski and John S. G. Simmons, “Permanence of Early European Hand-Made Papers,” Fibers and Textiles in Eastern Europe 11, no.1 (Jan./March 2003): 8–13. Fahy confirms the practice in seventeenth-century Italy. Conor Fahy, “Paper Making in Seventeenth-Century Genoa: The Account of Giovanni Domenico Peri (1651),” Studies in Bibliography 56 (2003–2004): 243–59. doi: 10.1353/sib.2007.0006
[2] J. A. Szirmai, The Archaeology of Medieval Bookbinding (Aldershot, UK: Ashgate, 1999), xvi, 352.
[3] In a personal communication to T. Barrett, Ann Blair recommended this excellent source on early modern marginal annotations in books: William H. Sherman, Used Books-Marking Readers in Renaissance England (Philadelphia: University of Pennsylvania Press, 2008). Blair mentions using an alum sizing to treat printed books to make them suitable for hand notations in the margins in “The Rise of Note-Taking in Early Modern Europe,” Intellectual History Review 20, no. 3 (September 2010): 310, notes 32 and 33.
[4] Charles Moïse Briquet, Les filigranes: Dictionnaire historique des marques du papier dès leur apparition vers 1282 jusqu’en 1600, 4 vols. “Jubilee Edition,” facsimile of the 1907 edition. (Amsterdam: Paper Publications Society, 1968), 3.
[5] Neil Harris, “The Shape of Paper," Paper and Watermarks. Institut d’Histoire du Livre. Accessed July 20, 2011. http://ihl.enssib.fr/siteihl.php?page=277&aflng=fr.
[6] Josef von Karabacek, Arab Paper, 1887, trans. Don Baker and Suzy Dittmar (London: Islington Books, 1991). See sections 203-06 on pages 54–55 and the table on page 70.
[7] Harris, “The Shape of Paper.”
[8] Karabacek, Arab Paper.
[9] J. Peter Gumbert, “Sizes and Formats,” in Ancient and Medieval Book Materials and Techniques: Erice, 18–25 September 1992, ed. Marilena Maniaci and Paola F. Munafo. Studi e Testi, (Città del Vaticano: Biblioteca Apostolica Vaticana, 1993), 227–63, 357–58.
[10] Ibid.
[11] Jonathan M. Bloom, in a personal communication to T. Barrett, states: “Parchment continued to be used later in the Maghreb (North Africa and Spain) than elsewhere in the Islamic lands, although paper was already being used and made there from around 1000 CE. There is a Spanish Christian manuscript from the tenth century, the Mozarabic Breviary and Missal in Silos, which uses both paper and parchment. There are still some Maghrebi Koran manuscripts on parchment dated to the first half of the fourteenth century (and maybe even into the fifteenth), but there are also secular and even Koran manuscripts on paper from the thirteenth century.” Bloom also cites a famous legal opinion from the early fifteenth century about whether it is acceptable to copy the Koran on European watermarked paper: Jonathan M. Bloom Paper Before Print, The History and Impact of Paper on the Islamic World (New Haven and London: Yale University Press, 2001), 85–89.
[12] Harris, “The Shape of Paper.”
[13] We have not investigated papyrus sheet sizes before assembly into rolls. Perhaps they will reveal a similar ratio. Paper and papyrus can be made into any rectangular shape the customer wants with minimal impact on net profit. The dimensions and ratios in the parchment trade were set, and we believe they drove the dimensions of the other two. (All three materials competed with one another in the Mediterranean area from 800 CE, when paper arrived, at least until around 1100, when papyrus production effectively ended. Parchment and papyrus competed with each other, arguably from 200 BCE until papermaking arrived, around 800 CE.)
[14] Irene Brückle, “The Role of Alum in Historical Papermaking,” The Abbey Newsletter 17, no. 4 (Sept. 1993). Accessed June 14, 2011. http://cool.conservation-us.org/byorg/abbey/an/an17/an17-4/an17-407.html.
[15] W. J. Barrow Research Laboratory, Physical and Chemical Properties of Book Papers, 1507–1949. Permanence/Durability of the Book 7 (Richmond, Virginia: W. J. Barrow Research Laboratory, 1974).
[16] T. Barrett, J. Waterhouse, and P. Lang, “Non-destructive Measurement of Gelatin and Calcium Content of European Book Papers: 1400–1800,” in Erice Book Conservation Conference Postprints (Sicily, Italy: Erice Book Conservation Conference, 2000), 604–24.
[17] John Baty and Timothy Barrett, “Gelatin Size as a pH and Moisture Content Buffer in Paper,” Journal of the American Institute for Conservation 46, no. 2 (2007): 105–21.
[18] See Conservation OnLine for an overview of permanent and durable paper standards. Accessed June 15, 2011. http://cool.conservation-us.org/byorg/abbey/napp/std.html
[19] Anne-Laurence Dupont, “Study of the Degradation of Gelatin in Paper upon Again Using Aqueous Size-Exclusion Chromatography,” Journal of Chromatography A 950 (2002): 113–24. doi:10.1016/S0021-9673(02)00010-9. Also note the plot of gelatin pick up versus solution concentration in A. L. Dupont, "Gelatine Sizing of Paper and Its Impact on the Degradation of Cellulose During Aging: A Study Using Size-Exclusion Chromatography" (PhD dissertation, University of Amsterdam, 2003), 232–33.
[20] Brückle, “The Role of Alum in Historical Papermaking.”
[21] Dupont, “Study of the Degradation of Gelatin in Paper Upon Again Using Aqueous Size-Exclusion Chromatography,” 113–24.
[22] Ibid.
[23] T. Barrett et al., “Non-destructive Measurement of Gelatin and Calcium Content of European Book Papers: 1400–1800.” Click on note 16 to follow the related discussion.