
Procedures: Specimen Selection
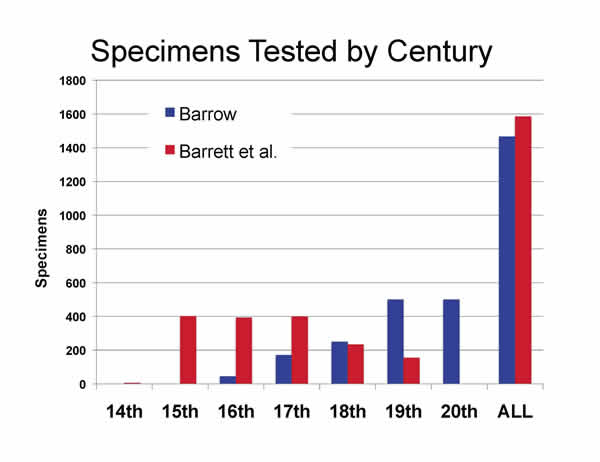
This graph shows, by century and in total, the numbers of specimens tested by Barrow (blue) and the corresponding numbers tested during our research (red). Our nondestructive methods allowed us to emphasize analysis of the relatively unstudied earlier papers. We selected our 1,578 specimens from a pool of about 4,000 drawn from collections at The University of Iowa and the Newberry Library. We worked to select papers that appeared to be free from any binder’s or conservator’s aqueous treatment. Thus we excluded any papers that were overly flat and smooth, as well as books in late bindings with heavily trimmed margins.
The table below shows the final counts.
| SPECIMEN SET | 14th c | 15th c | 16th c | 17th c | 18th c | 19th c | 20th c | TOTAL |
|---|---|---|---|---|---|---|---|---|
Barrow |
0 |
0 |
45 |
175 |
250 |
500 |
500 |
1,470 |
Barrett et al. proposed |
5 |
360 |
350 |
330 |
250 |
200 |
0 |
1,495 |
Barrett et al. final |
5 |
396 |
392 |
397 |
233 |
155 |
0 |
1,578 |
|
||||||||
Manuscript books |
5 |
47 |
5 |
3 |
0 |
0 |
0 |
60 |
Manuscript leaves |
0 |
5 |
10 |
12 |
8 |
0 |
0 |
35 |
Printed books |
0 |
200 |
352 |
298 |
100 |
131 |
0 |
1,081 |
Printed leaves* |
0 |
144 |
23 |
82 |
112 |
2 |
0 |
363 |
Art prints |
0 |
0 |
1 |
2 |
9 |
18 |
0 |
30 |
Blank leaves |
0 |
0 |
1 |
0 |
4 |
4 |
0 |
9 |
Barrett et al. totals |
5 |
396 |
392 |
397 |
233 |
155 |
0 |
1,578 |
*Of the 363 printed leaves analyzed in this research, 200 were from the same books used during the Barrow study. They were not, however, the same leaves used to gather the Barrow data because those leaves were destroyed during testing.
During our specimen-selection work an important goal was to choose, across the centuries, a balance of good- and poor-quality papers. The quality assessment was based on two of our team members’ expertise as hand papermakers. In these informed, but still subjective, evaluations of materials and workmanship, poor quality was evidenced by stray foreign fibers, straw, bits of debris, lumps, clumps, and signs of quick or unskilled sheet forming or couching.
At the other extreme were papers that appeared uniform in high-quality rag fiber content; had a minimum of stray fibers or debris, and in transmitted light showed freedom from knots or clumps, exceptional formation quality, and evidence of careful couching.
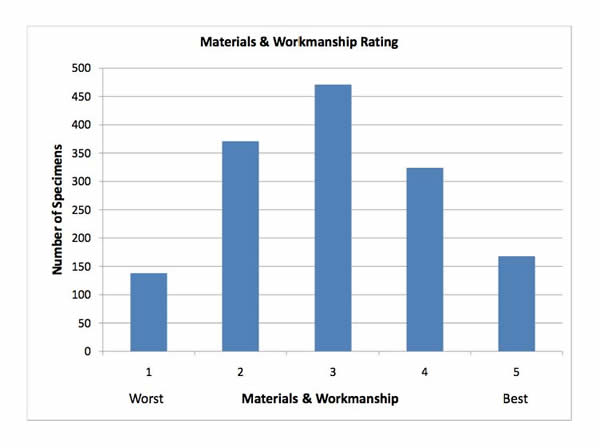
The chosen specimens represented a fairly normal distribution of paper quality, from worst to best (fig. 4), with the highest count falling in the middle with a materials and workmanship (M&W) grade of 3.
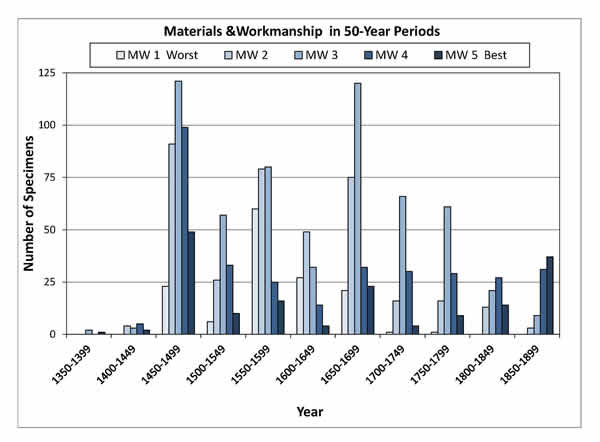
Figure 5. Distribution of M&W grades by half century.
We wish to make clear that equal distribution of specimens across centuries and by country was not possible. This can be seen in the plots that show, by date, the “weight percent gelatin” (percentage of gelatin by weight ) concentration for the samples from each country (fig. 6).
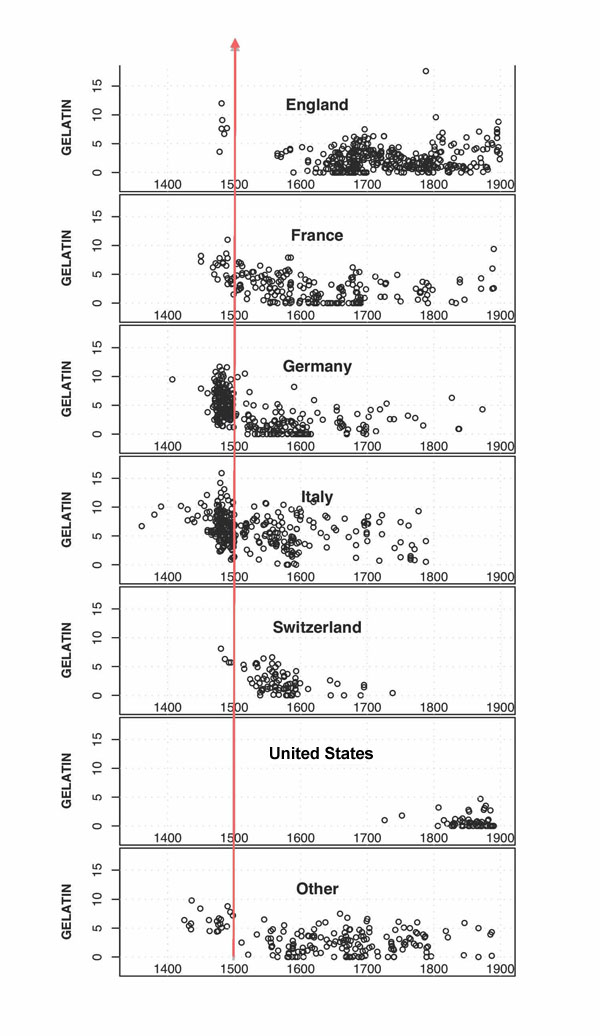
Each open circle on the plots represents a different specimen analyzed. (More on gelatin concentration follows under RESULTS below.) In figure 6 it is evident that we tested few papers from fifteenth-century England but a relatively high number from fifteenth-century Italy and Germany, primarily because at that time a great deal of book production took place in Italy and Germany and very little in England. By the mid-seventeenth century this had reversed, and we clearly had access to fewer Italian and German books and more British books.
The overall composition of our specimen pool was due, therefore, to several things: (1) the nature of the collections from which it was drawn, (2) the history of book production in Europe, and (3) our attention to selecting a mix of good- and poor-quality papers. It is important to keep in mind the location bias we see in figure 6 because it can play a role in the results, especially any results plotted over time. Additional consideration of bias in the specimen pool follows below under the DISCUSSION heading.
Our original goal was to include for each century approximately twenty “art prints,” which we generally considered to be etchings, woodcuts, or lithographs that were either matted or bound into books. However, only a fraction of the University of Iowa Museum of Art’s extensive print collection was available to us, having been moved to safe and secure storage during the flood of June 2008. We therefore increased the number of other specimen types tested from the earlier centuries.