
Procedures: Experiment B: Nondestructive Estimation of Strength in Historical Papers
- Tim Barrett, principal investigator, director of paper facilities, University of Iowa Center for the Book
- Mark Ormsby, physicist, Research and Testing, National Archives and Records Administration
- Lee Marchalonis, research assistant, University of Iowa Center for the Book
- Heather Wetzel, research assistant, University of Iowa Center for the Book
Additional contributions from Wavell Cowan, Jessica White, Yasmeen Kahn, Nancy Kraft, Gary Frost, Kristin Baum, and Beth Stone
Abstract
An experiment was designed to evaluate the ability of UV-Vis-NIR spectrometry and ultrasonic (US) methods to nondestructively predict destructive Pulmac zero- and short-span tensile paper-strength test results. During the experiment, three historical specimens and two controls were tested using UV-Vis-NIR and US methods and then subjected to five different aqueous treatments common in book conservation work. Between fifty-four and seventy-two 2 × 3 cm tabs were cut from each specimen. The historical specimens’ tabs were cut only from print-free areas between the chain lines, with the tabs oriented in the long direction, parallel to the chain lines. During the experiment, 342 tabs were assembled. Each received five UV-Vis-NIR and five US analyses followed by ten destructive tests using a Pulmac Zero-Span 1000 tester. In total 3,420 nondestructive and 3,420 destructive tests were undertaken. Our results led us to conclude that our NIR and US methods were not viable for estimation of paper strength values in widely varying fifteenth through eighteenth century historical specimens or for monitoring paper strength during single item conservation treatment, however other researchers have successfully used NIR and mid-IR techniques to predict tensile strength in nineteenth century and more modern historical specimens. In a preliminary analysis of thirty-eight historical specimens, darker, redder and more yellow paper color appears to be associated with lower pH, degree of polymerization, and Pulmac wet zero-span (fiber strength) values. Both UV-Vis-NIR and color deserve continued research attention for use in nondestructively predicting properties related to paper strength.
Background
Use of US testing in the paper industry
The longer cellulose fiber is beaten or refined, the more dense and compact the dried paper becomes. Many strength properties also increase during this transition. The discovery that paper transmits sound more readily with increased beating time (either across the plane of the sheet or through the thickness) led to research linking US sound readings to reliable nondestructive predictions of paper strength normally only testable through destructive means. In the modern machine-papermaking trade, US methods can successfully predict destructive test values, including those for a moving web of paper on a machine.1, 2, 3, 4
In the early 1980s, Christopher Tahk suggested the possible use of US methods in conservation.5 Although early experiments using US instrumentation on historical papers had mixed results, the method remained attractive.6, 7, 8 Some of these researchers were aware that increasing gelatin concentration, like increasing refining or beating time, can augment certain strength properties, and they observed that some US properties also increase with gelatin addition.9, 10, 11 This raised the possibility that US testing might predict gelatin content in addition to, or instead of, strength properties.
Early US testing
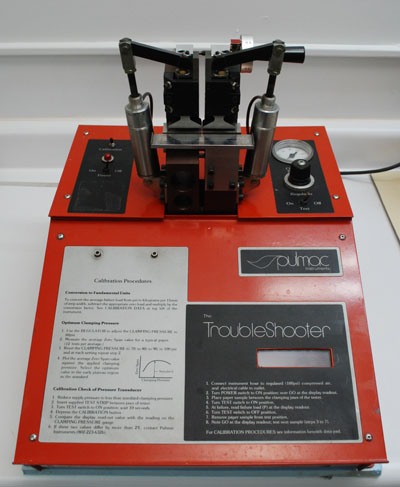
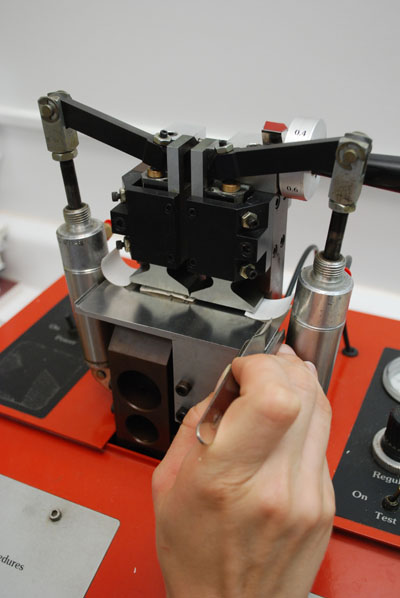
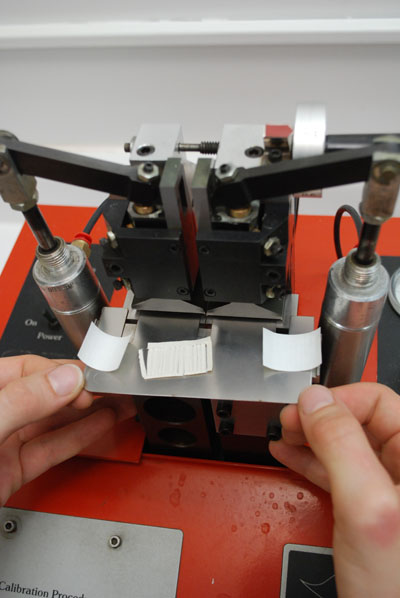
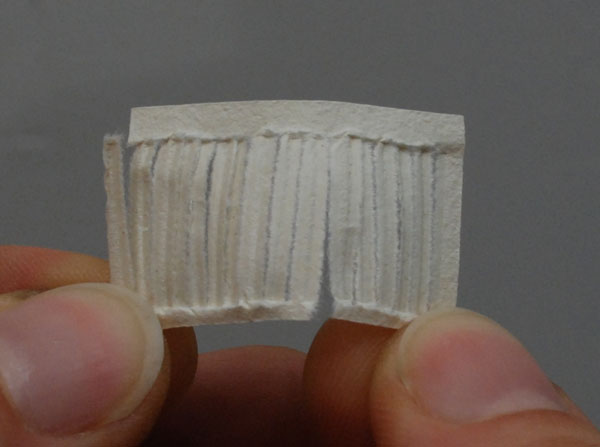
Pulmac Zero-Span 1000 instrument
To begin preliminary investigations prior to Experiment B, we generated data from a destructive test instrument that could be compared to data from our nondestructive test instruments. We selected a Pulmac Zero-Span 1000 tester because it could provide ten to twelve tests on a single 2 × 3 cm tab of paper. The maximum number of tests possible per centimeter is a priority when testing historical specimens, as material available for permanent destructive tests is in limited supply.12 The Pulmac tester is normally used in the paper industry, and a number of standard procedures for its use are available.13 The instrument is designed to test three properties: zero-span wet, short-span wet, and short-span dry. In the first two tests the sample is wet to interrupt all possible bonds within the mechanical and chemical structure of the paper. The latter two tests are done with the instrument’s jaws set 0.4 mm apart. The Pulmac instrument allows three fiber-quality measures to be generated from the raw data:
Fiber strength (FS) = wet zero-span value
Fiber length (L) = wet short span / wet zero span
Bonding (B) = dry short span / wet short span
The results can be corrected to a common 60 GSM (grams per square meter, or “grammage”) for comparison purposes.
Both of the wet Pulmac tests require the paper be fully wet. We determined that a ninety-minute presoak in 70°C distilled water was necessary to completely soften any gelatin present in the most heavily sized controls we planned to use in our experiments. Many of the historical specimens, also known to be gelatin sized, wetted out much more quickly, but we decided on this common treatment to ensure that all papers were treated in the same manner. The argument can be made that this ninety-minute soak in relatively hot water could potentially damage the sample. We remained convinced that all samples should be treated equally and elected to consider the pretreatment, even if it changed fiber properties, a form of accelerated aging to which all samples were exposed.
Of the three tests, the dry short-span tensile test perhaps comes closest to simulating the type of mechanical failure the paper might be exposed to in actual use, such as in a stressed endpaper glued to the board in a binding or a tightly bound leaf pulled too hard against its sewn-in gutter fold.
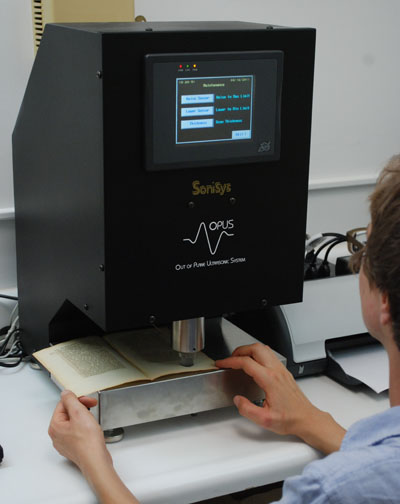
SoniSys OPUS Z-direction ultrasonic tester
To provide nondestructive US data we employed a SoniSys OPUS Z-direction ultrasonic tester (fig. 5) that measures the rate at which sound travels through the thickness of a sheet of paper in an area with a 1.5 cm diameter. Test data is output as thickness, specific stiffness, Young’s modulus, density, impedance, time, velocity, and attenuation. Young’s modulus and specific stiffness are primary output values; however, the grammage must be input to obtain Young’s modulus values. As this is problematic when testing pages in bound books, we focused our attention on specific stiffness values.
UV Viz NIR spectrometer
The Analytical Spectral Devices instrument used for the UV-Vis-NIR work is described in the PROCEDURES section.
ICP series tests
In our first effort to determine if US measurements could predict destructive Pulmac test values, the historical paper specimens shown in table A were selected from specimens available in the University of Iowa Center for the Book (UICB) collection described in note 12. The ICP series specimens were originally assembled for analyses using an inductively coupled plasma mass spectrometer. The experiment was later canceled but the ICP acronym remained.
TABLE A: ICP Series Specimens (a.k.a. I Series Specimens)
| SPEC | DATE | PUBLICATION; OTHER IDENTIFICATION | GSM | NIR Gel |
|---|---|---|---|---|
1 |
1483 |
Johannes Capreolus, Defensionum Theologia, Thomas Aquinatis |
93 |
7.2 |
2 |
1495 |
Johannes Antonius, Campanus Opera |
95 |
4.2 |
3 |
1486 |
Gregorius the First, (Moralia), Sopra la Vita di Job |
88 |
7.0 |
4 |
unknown |
Antique laid, knotty, light in color, high Ca? |
95 |
7.6 |
5 |
1727 |
Histoire de Polybe, Paris |
71 |
5 |
6 |
1776 or 1789 |
Traite Sur La Cavalerie, Paris |
118 |
2.9 |
7 |
1764 |
The History of English Poetry |
102 |
3.1 |
8 |
1803-53 |
Atlas Historique Tome III title page; antique laid, Paris |
99 |
6.8 |
9 |
1803-53 |
Ditto; Suite de la Chronologie, Ferdinand II; antique laid, Paris |
82 |
5.6 |
10 |
1695 |
Oratio Funebris, Amsterdam |
97 |
4.4 |
11 |
1768 |
History of Scotland, London |
82 |
3 |
12 |
Barron de Tott |
57 |
2.1 |
|
13 |
1584 |
H. Wolf. In Ciceronis Officia. WB 1523, D17 |
73 |
2.7 |
14 |
1757 |
Monsieur l’Abbe. Histoire des guerres civiles. V.2. TB T99, WB 1101, D19 |
80 |
2.9 |
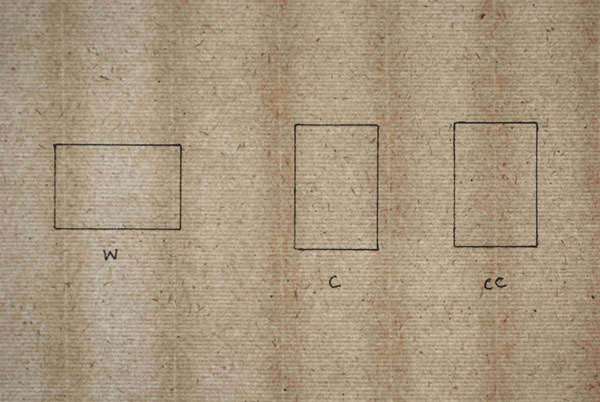
Using a glassine overlay, three tabs were located on each paper specimen for each of the three orientations (W, C, and CC) shown in figure 6. The same leaf or bifolio from each specimen was used for all tests.
Once the tab positions were confirmed on the glassine, they were transferred directly to the specimen, lightly in pencil, using a light table. An ID number was added in the lower right of the tab (as viewed horizontally). Five UV-Vis-NIR and five US analyses were then executed, working across the long (3 cm) direction of each tab, using the ASD UV-Vis-NIR and SoniSys OPUS instruments, respectively. After the nondestructive analyses, the tabs were cut out. For each of the tab orientations, one tab was subjected to the wet zero-span test, another to the wet short-span test, and the third to the dry short-span test. Thus each specimen had 9 tabs cut and tested. With fourteen specimens, 126 tabs were cut. At an average of ten Pulmac tests per tab, roughly 1,260 destructive tests were done. Therefore a total of roughly 2,520 nondestructive and destructive tests were undertaken during this preliminary work to Experiment B.
Note that the W-orientation tabs’ test failure lines occurred parallel to the chain-line direction, but in the C and CC tabs they occurred against the chain-line direction (see fig. 6). Interestingly, when we tabulated the ratios for raw dry short-span values (W/W, W/C, and W/CC in table B), it became clear that there is, on average, grain and higher strength in the chain-line direction. This fact was taken into consideration in all subsequent work. Raw data for table B is shown in the appendix at the end of this document.
TABLE B: Grain Direction and Strength Differences in ICP Series Historical Specimens
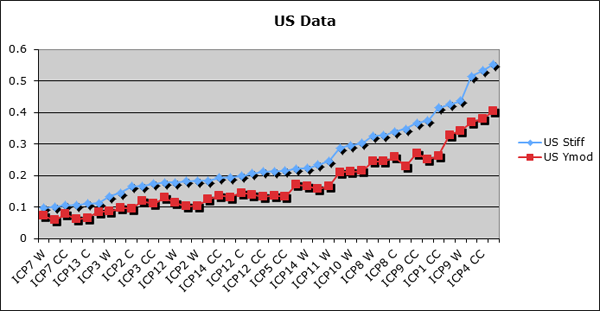
In plot 1, when the resulting data set is plotted by increasing US stiffness values, a close correlation is seen with Young’s modulus, the other US property of interest. However, when all the resulting Pulmac values are shown in the same order in plot 2, little or no relationship with the US data is evident. (Note that not all tab names appear along the horizontal axis). Raw data is not reported here but is available on request.
Modern handmade paper tests
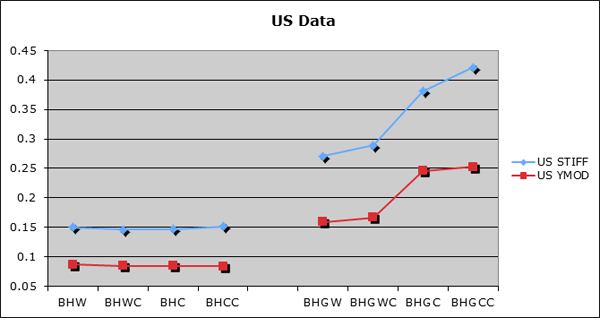
We tried a similar analysis of two modern handmade hemp papers, BH, and BHG (the same BH paper sized in a 4% solution of Gelita bone gelatin with potassium aluminum sulfate added at 1% based on the weight of the dry gelatin.)14 For this test we included a fourth tab orientation, WC, which was the same as the W tab pictured in figure 6 but including a chain line in the middle of the tab. Two BH tabs were given zero-span tests, two were given wet short-span tests, and two were given dry short-span tests; that is, six tabs were tested per tab orientation, or a total of twenty-four tabs of BH paper. The same tests were done for the BHG paper. US tests were also conducted on the same papers: 5 per tab, followed by an average of 10 destructive tests per tab, or 480 destructive tests overall, and a combined total of 720 nondestructive and destructive tests. Raw data is not shown for this work but is also available on request.Curiously, the resulting US data in plot 3 (above) shows little or no difference among tab types for the unsized BH paper but clear changes among the tab types for the BHG paper with gelatin added.
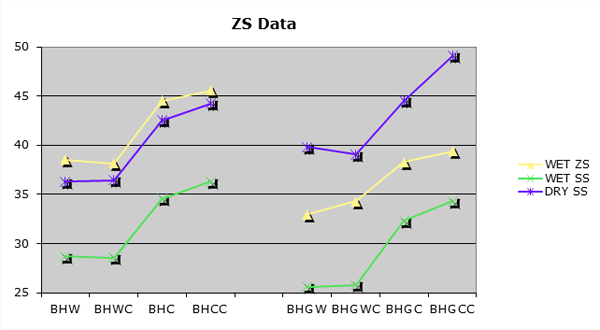
More importantly, in the destructive Pulmac data in plot 4 the changes that occur in the BHG gelatin-sized sheet closely agree with the US data. Correlation values between the US mean stiffness and Pulmac average raw dry short-span data were very high for the BHG paper (.978) but low (.471) for the unsized BH paper.
We were encouraged somewhat by these results for gelatin-sized paper. Because we believed that most historical papers made between 1300 and 1800 contain gelatin, and because we hoped to be able to use the US instrument in our planned field study of 1500-plus historical specimens, we elected to do additional preliminary work on a larger group of historical specimens.
Forty-specimen series
Paper specimens shown in table C were selected for testing.
TABLE C: Forty-Specimen Series
Note: Some attributions require additional research or clarification. WB = William Barrow Laboratory ID number. TB = Barrett ID number from previous research or other identification information. Series contains an equal number of noticably darker and lighter specimens.
ID # |
ID |
YEAR |
CITY or COUNTRY |
GSM |
Darker |
||||
D1 |
T. Warton. The History of English Poetry TB UI Coll. |
1764 |
London |
86 |
D2 |
J. Busaeus. Arca medica variis divinae scripturae. WB 1484 |
1608 |
Monguntiae (Mainz) |
54 |
D3 |
P. Francii. Oratio in Funere TB UI Coll. (from T. Cains) |
1695 |
Amsterdam |
104 |
D4 |
J. Ogilvie. Poems on Several Subjects. Vol. II. TB UI Coll. |
1769 |
London |
76 |
D5 |
T. Percival. Essays Medical and Experimental. TB UI Coll. |
1772 |
London |
94 |
D6 |
De Convulsionibus. TB UI Coll. (from R. Espinosa) |
1749 |
Paris |
77 |
D7 |
Bishop Burnet's history. WB 1170 |
1734 |
London |
68 |
D8 |
P. Gregorie. Opera Omnia ad Jus Ponfificum spectantia. WB 1382 |
1645 |
Geneva |
59 |
D9 |
A. Mincucci. De Feudis libri sex. TB W35, WB 1269 |
1695 |
Strasbourg |
66 |
D10 |
B. Romans. Annals of the troubles in the Netherlands. V.1. TB T91, WB 1052 |
1778 |
CT/USA |
61 |
D11 |
The law of the covenants. WB 1214 |
1711 |
Savoy |
59 |
D12 |
Unprinted leaf watermarked “1757” (from S. Patri) |
1757 |
unknown |
75 |
D13 |
Feltwell. “Printed in London, 1739.” TB UI Coll. (from R. Espinosa) |
1739 |
London |
76 |
D14 |
R. P. F. Joannis Nider Ordinis Praedicatorum Theologi De Reformatione Religiosorum. WB 1452 |
1611 |
Antwerp |
80 |
D15 |
The humble and modest inquiry. TB P97, WB 1158 |
1733 |
Edinburgh |
71 |
D16 |
J. Burrow. Reports of cases, V. 1. TB P72, WB 1019 |
1793 |
London |
81 |
D17 |
H. Wolf. In Ciceronis Officia. WB 1523 |
1584 |
Basel |
73 |
D18 |
The eleventh part of the reports of Sir Edward Coke, Kt. WB 1187 |
1727 |
Savoy |
83 |
D19 |
Monsieur l'Abbe. Histoire des guerres civiles. V.2. TB T99, WB 1101 |
1757 |
Amsterdam |
98 |
D20 |
Plutarch. Plutarch quae exstant omnia. TB 45, WB 1512 |
1599 |
Frankfurt |
71 |
ID # |
ID |
YEAR |
CITY or COUNTRY |
GSM |
Lighter |
||||
L1 |
Biblia Latina. Nicolaus Jenson. BMLV 180, Goff B563 |
1479 |
Venice |
91 |
L2 |
Blondus. Angelum Britannici Press. Roman History |
1503 |
? |
85 |
L3 |
James McBey Collection of Watermarked Paper, Specimen 18 |
1770? |
Spain |
81 |
L4 |
Anno Regni Georgii Regis (from R. Lieberman) |
1723 |
London |
72 |
L5 |
The Muses Library; or a series of English Poetry. TB UI Coll. |
1737 |
London |
98 |
L6 |
Politanus Opera, Aldus. UI SC PL |
1498 |
Venice |
96 |
L7 |
Johannes Antonius Campnus Opera. Printed by E. Silber. TB G15 |
1495 |
Rome |
88 |
L8 |
Jean de Charlier de Gerson. Goff G186, TB UI SC Griffin |
1488 |
Strasbourg |
81 |
L9 |
Blondus, Flavius. Historium AB Inclinatione. Printed by O. Scotus |
1483 |
Venice |
100 |
L10R |
M. Velleii. Paterculix Que Supersunt. WB 1208 |
1711 |
Oxford? |
78 |
L11R |
Bible, (in German). Zainer. UI SC PL duplicate |
1477 |
Augsburg |
103 |
L12 |
Horatius Flaccus. Guintus Opera. TB G14 |
1482 |
Florence |
80 est. |
L13 |
Blank leave with three hills watermark. TB G17, (from R. Espinosa) |
1400s |
Italian? |
81 est. |
L14 |
F. Biondi. L’istoria delleverrecivili. D’ inghilterra tra le due cafe di lancaftro e iorc. TB 146, WB 1379 |
1641 |
Venice |
109 |
L15 |
A narrative of the proceedings of the lower house of convocation. TB T2, WB 1239 |
1701 |
London |
66 |
L16 |
The fifth part of the reports of Sr. Edward Coke Knight. TB T165, WB 1340 |
1660 |
London |
83 |
L17 |
James McBey Collection of Watermarked Paper, Specimen 32, TB T25 |
1700s |
? |
89 |
L18 |
Antonius De Bitonto. Sermones Quadragesimale De Vitiis. TB G/T16 |
1499 |
Venice |
75 |
L19 |
The history of the reign of Henry the Fifth. TB T3, WB 1245 |
1704 |
London |
79 |
L20 |
T. Aquinatis. Johannes Capreolus Defensionum Theologia. TB G/T12 |
1483 |
Venice |
87 |
One 2 ×3 cm “A” tab was cut from each of the forty historical paper specimens in the C orientation shown in figure 6. It was tested in five locations using the SoniSys US instrument and five locations using the ASD UV-Vis-NIR instrument, followed by approximately ten wet zero-span destructive tests. In a similar fashion, one 2 × 3 cm “B” tab was cut from each specimen and given the same nondestructive analyses, followed by approximately ten Pulmac dry short-span tests. Therefore eighty tabs were analyzed with eight hundred nondestructive and eight hundred destructive tests: sixteen hundred tests overall. The resulting data is compiled in table D.
TABLE D: Forty-Specimen Series Test Results
These results we summarized in the R2 values shown in table E.
Table E: Forty-Specimen Series, US versus Pulmac Values
The results were not encouraging. When considering US data from two tabs from the same specimen, we would have expected to see a very close correlation (US Stiff A/B and US Ymod A/B), but the results were only fair to good (about a .8 R2 value), indicating that the US properties of historical specimens may vary significantly within the same sheet.
The results for US versus Pulmac tests were weak, with the possible exception of US stiffness of the B tabs versus raw data for the Pulmac dry short-span test (Stiff B / Dry S Raw), where the R2 value was about .7.
The combined results of all the above work led us to conclude that US methods were not viable for estimating paper-strength values in widely varying historical specimens. The instrument was therefore not employed during the field analysis of 1,578 specimens. However, based largely on the BHG results, we designed Experiment B to include the SoniSys US instrument as well as the ASD UV-Vis-NIR instrument to determine if either could be used to monitor changes in strength in the same specimen during conservation.Experiment B
Goals
(1) Execute a study to monitor changes in strength (Pulmac zero span and short span) in the same paper specimen during representative book conservation washing and resizing treatments, and (2) investigate the accuracy with which UV-Vis-NIR and US techniques can predict those changes nondestructively.
Procedures
Three historical specimens and two controls were selected and are shown in table F.
Table F: Experiment B Specimens
| SPEC. | DATE | PUBLICATION; OTHER IDENTIFICATION | GSM | Cm2 available | NIR % gelatin | Tabs available* |
|---|---|---|---|---|---|---|
| 76 | 886 | 3.8 | 76 | |||
| 88 | 886 | 2.1 | 76 | |||
| 97 | 812 | 4.2 | 66 | |||
| 72 | 1305 | 6.4 | 104 | |||
| Est. 96 | 3.5 | 72 |
* All are “C”-orientation tabs cut in the valley between chain lines.
Note that the selected historical specimens were chosen not because they were typical candidates for aqueous treatment but because they were large enough to permit cutting the required number of 2 × 3 cm tabs from print-free regions of a single bifolio leaf.
Steps taken during the experiment:
- Tab-location layouts were finalized on glassine for each specimen to avoid any major defects in the paper, such as creases, water drops, or foreign matter. All tabs left a minimum of about 1 cm extra on all sides, to ensure that the UV-Vis-NIR probe would always be on top of paper (sometimes with printing included at the very edge of the probe circumference but never exposed to the light source). The extra paper was also included to minimize possible effects of wicking at sheet edges during drying following treatments. This layout dispersed four groups of three A tabs each (in locations designated AI, AII, AIII, AIIII) around the specimen. These were considered the “before-treatment” tabs. All final tab positions were outlined on the glassines with a fine-tip black marker (A tabs in red) to make them easier to see under the historical specimens on a light table. Each tab position was marked with a unique number per the scheme outlined below. Zero-span wet (Z), short-span wet (SW), and short-span dry (SD) tabs were evenly distributed within a treatment protocol group but “nested” together to aid in wet-treatment work.
- On a light table, the tab positions for all specimens were penciled in along with unique tab numbers in the lower right of each tab. All testing, destructive and nondestructive, proceeded from the left (bare) end of the tab to the right (numbered) end.
- Each specimen was cut into A, B, C, D, E, and F treatment sections. The total area for each was about the same, including waste at edges. All glassines were retained in case tab numbers were abraded during treatments.
Tab numbering scheme:
For example, in “1AZ2,”
1 = specimen number (from table F above)
A = protocol (see list below)
Z = Pulmac test type (Z = wet zero span, W = short wet, D = short dry)
2 = number of tab (1–4, except specimen 3, which had only 1–3)
Preconditioning and conditioning
Before and after all aqueous treatments, and prior to any nondestructive testing, all specimens were preconditioned in an oven at 40°C into which was drawn 23°C air with a relative humidity (RH) of 51%–65%. The specimens were then conditioned in the lab for twenty-four hours before US testing under the same temperature and RH conditions. Note: this level of RH control was not as stable as would have been preferred. RH can impact thickness, and the effective distance traveled by the US sound waves during a test is the thickness of the sheet. However, especially low RH values are most problematic in US analysis of modern machine-made wood-pulp papers. The impact of this range of RH variation on US data from naturally aged historical papers produced from linen and hempen fiber and impregnated with gelatin is unknown. Over the 35%–65% RH range, little or no impact on Pulmac dry short-span test results was expected, based on Pulmac instrumentation-specialist experience.15
Nondestructive testing
All tabs for all specimens were tested using UV-Vis-NIR and US at five locations evenly spread from left to right across the tab. The UV-Vis-NIR probe light could be positioned at the very edge of a tab, but the US pad edge was not allowed over the edge of the tab on the left or right. This located the US pad toward the tab center as it proceeded from left to right.
Aqueous treatment protocols
A: untreated
B: wash, dry
C: wash, dry, size, dry
D: wash, dry, alkalinize, dry, size, dry
E: wash, size, dry
F: wash, alkalinize, size, dry
We included treatments with and without drying between various solutions to see if there was any variation in uptake of gelatin and therefore paper-strength measurements.
Sequence of treatments
All specimens were cut down to their final size for wet treatment. B–F sections from the same specimen were washed together in the same bath (ten baths were required for five specimens due to two ten-minute baths for each specimen); then all B, C, D sections were dried, but all E sections were taken straight to separate size baths (five required), and all F sections went straight to separate alkalization baths (five required) followed immediately by a separate size bath. After drying for twenty-four hours, C sections were sized and D sections were alkalized in fresh baths (five separate baths required for each specimen for sizing and also for alkalization). After drying for four hours, D sections were sized in a fresh bath. All final drying steps were followed with preconditioning, conditioning, and nondestructive testing.
Details of treatments
Treatment specifics were recommended by Yasmeen Khan and drew heavily on procedures used at the Library of Congress (LC) book conservation section. A number of these steps were published in a recent Book and Paper Group Annual in connection with LC protocols for treatments related to iron gall inks.16 Similar treatments have been used by other book conservators in the United States (see Book Conservation Catalog Wiki chapters on washing and alkalinization)17.
Actual wet treatment took place during two sessions, on July 1 and 2, 2010. The pH of water available in the book conservation laboratory at the University of Iowa was checked using a Fisher Scientific accumet XL15 pH meter. First, stock solutions of pH 4, 7, and 10 were tested to ensure that the meter readings were accurate (-4.17 and 7.07, respectively).
pH of the tap water: 9.66
pH of deionized water from lab water system: 6.3
pH of recalcified water from lab water system: 9.7
Based on alkalinity of the lab water system, wash-water baths for the specimens were drawn using deionized water mixed with recalcified water to the proportions of 2:1, resulting in a pH reading of 8.6.
Solutions of 0.1 M magnesium bicarbonate were mixed using the LC measurements of 5.8 g of magnesium hydroxide powder per liter of deionized water; 4 liters of solution were made using a SodaStream carbonation system. The solution was allowed to settle before diluting it for the alkalinization treatment step.
Gelita photo bone gelatin from the UICB Research and Production Paper Facilitywas used to make up a 1.5% solution of gelatin size. Seventy-five grams of gelatin was mixed with 5 liters of tap water, allowed to swell for one hour, and heated gently until finger warm (approximately 40°C).Washing
Two trays were marked with the number of each specimen, and both were filled with wash water (1500 ml each). A lettered specimen section was placed on nonwoven polyester web support for washing. It was sprayed with a solution of 50% isopropanol in water, turned over, and sprayed again before submerging web and paper into the water. The action was repeated with sections B–F from each specimen. A timer was set for ten minutes for each specimen group of sections immersed. The samples were stacked in each bath according to the treatment protocols in the following order: B, C, D, E, and F. (Each specimen had a designated person specifically responsible for the washing step.)
At minute five, the samples were pressed down and then flipped so that sample F was on top. At minute ten, the samples were pressed down, flipped over, lifted, and allowed to drain for thirty seconds before being placed in the second washing bath, with section B on top. The timer was reset. At minute five, the sections were pressed down again and flipped over. At minute ten, the sections were pressed down in the water, and then removed from the bath and placed in a photo tray, with section B on top.
Sections B, C, and D from all five specimens were placed on drying racks with their respective nonwoven polyester web supports. Section E samples were left in the photo trays.
Alkalinize
The 0.1 M magnesium bicarbonate solution was diluted with deionized water to the proportion of 1:3 for the alkaline baths with a pH of 9.1. Five baths (750 ml) were prepared, one bath for each section F sample. The sections, on their respective nonwoven polyester web supports, were submerged in them for twenty minutes, and the solution was agitated twice by hand. They were placed on the drying racks to drain for five minutes while the next treatment steps were being prepared.
Size
Two trays were set out, one for each specimen section E and F. Each sample, along with its polyester web support, was placed in a tray, and 500 ml of 1.5% gelatin (at approximately 40°C) was poured on top. The samples remained submerged in the gelatin for ten minutes. They were removed and placed, with their polyester web supports, onto blotters. After drying for a few minutes, the excess moisture (gelatin) on the rectos of the sections was blotted. The sections were transferred to the drying racks, and the corners of their polyester web supports were cut off (to identify them for use only with other gelatin-related protocols).
Dry
Completed sections E and F were put into drying stacks. Each section was sandwiched between a clean blotter and nonwoven polyester web. The whole stack was covered with a drying board and weighted. Sections B–D were still damp and placed between blotters without any polyester support. They were stacked on top of samples E and F, with a drying board and weights on top.July 2
Fresh gelatin size was prepared as described above and sections C were sized and dried as described above.
Alkalinize
The stock solution of 0.1 M magnesium bicarbonate made on July 1 was diluted with three parts deionized water for the alkaline treatment baths. Washed sections D were removed from the drying stack. Five baths were prepared, one for each section D. After spraying both the recto and verso of each sample (while still on its nonwoven polyester web support) with 50% isopropyl alcohol to decrease surface tension, they were submerged in the bath for twenty minutes, and the water was agitated twice by hand. Sections D were removed and placed on the drying racks to drain for ten minutes, and then dried between blotters and clean nonwoven polyester web supports for four hours. The blotters were changed after the first hour.
Size, continued
Gelatin was prepared again as described above. Each section D sample, on a polyester web support, was placed in a tray and 500 ml of 1.5% gelatin (at approximately 40°C) was poured on top. The samples remained submerged in the gelatin for ten minutes. They were removed and placed, with the polyester web supports, onto blotters. After drying for a few minutes, the excess moisture (gelatin) on the rectos of the samples was blotted. Sections D were transferred to the drying racks for ten minutes. Finally, each sample was sandwiched between a clean blotter and nonwoven polyester web. The whole stack was covered with a drying board and weighted.
Final nondestructive testing
All wet-treatment drying steps were followed by preconditioning and conditioning steps as described above. All remaining nondestructive analyses were then accomplished for all specimens. Extra material from the edge of each specimen section was left around the tabs until all treatments and nondestructive tests were complete. At that point all tabs were cut from their respective specimen sections.
Destructive testing
The six protocols (one untreated, five treated) resulted in twelve tabs for destructive testing for each protocol: four tabs each for wet zero-span, wet short-span, and dry short-span tests. Specimen 3 yielded only nine tabs for each protocol: three tabs each for the wet zero-span, wet short-span and dry short-span tests. Note: wet Pulmac tests could be executed on any day without preconditioning and conditioning as long as the same wetting procedures were followed (presoak in 70°C water for seventy-five minutes). The dry short-span test, however, had to be done following preconditioning and conditioning. Total destructive and nondestructive tests executed are shown in table G.
Table G: Summary of Experiment B Tests
Results
A summary of all Experiment B Pulmac results is shown in table H.
Table H: Pulmac Destructive Test Results, by Specimen and Treatment
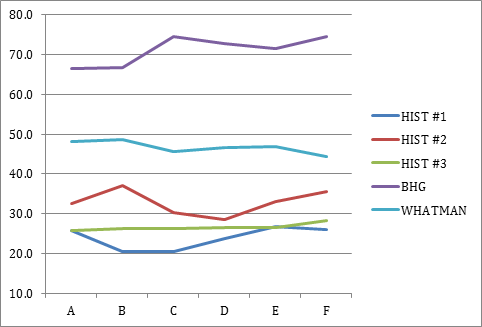
The numerical data in table H is summarized in the following four plots, which show the trends in Pulmac test values versus treatment protocol, by specimen.
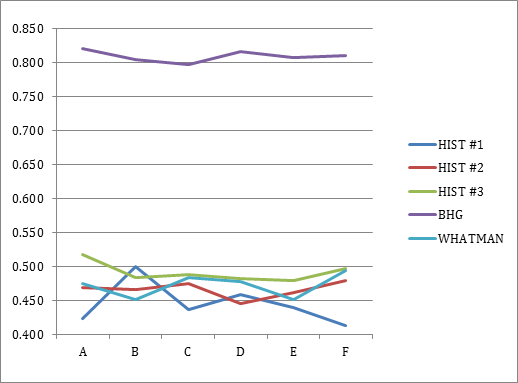
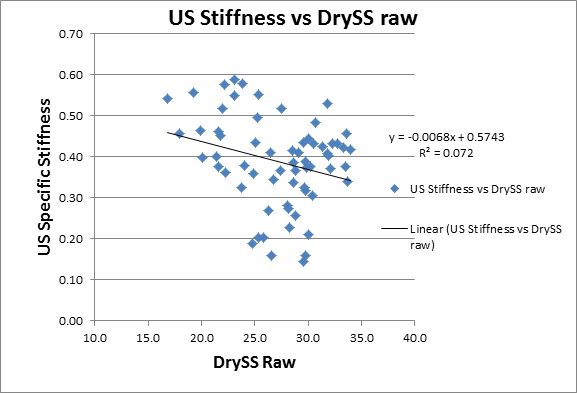
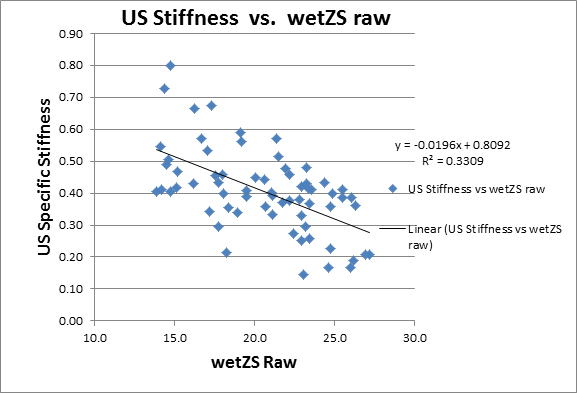
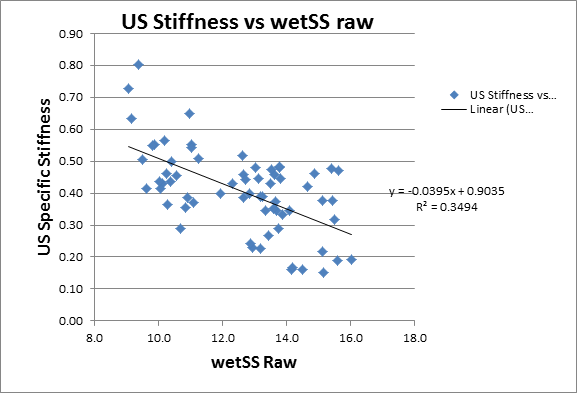
In the following three plots US stiffness, the key ultrasonic variable that does not require an initial input of grammage (gsm), is plotted against the uncorrected (raw) Pulmac values.
As a result of the poor correlation between the US and Pulmac values, the UV-Vis-NIR spectra were analyzed as follows.
UV-Vis-NIR modeling
The UV-Vis-NIR model for gelatin described in the PROCEDURES section is based on broad peaks in the UV-Vis-NIR spectra that are associated with molecular vibrations of gelatin molecules. In contrast, by attempting to use the chemical information in UV-Vis-NIR spectra to model Pulmac dry short-span (DSS) physical measurements, we are relying on general correlations rather than on specific peaks that are directly related to DSS. While there are legitimate questions about the validity of this approach, we explored the DSS modeling because nondestructive methods for measuring historical paper strength have only recently been developed. Dirk Lichtblau et al. described a UV-Vis-NIR method for predicting tensile strength in nineteenth-century through modern papers. 18 We hoped that by averaging the results from many specimens our model might indicate general trends for DSS.
Our trial DSS model was developed from all sixty-six DSS tested tabs from the three historical specimens (listed in table F) that received treatments in Experiment B. Due to lack of homogeneity in handmade paper and the impact of the various treatments, we treated each tab as a unique sample. A total of sixty-six spectra were therefore analyzed to generate a model that distinguished six factors. As was done with the gelatin model, peaks associated with water were excluded. To test the model, it was used to predict the DSS values for thirty-nine of the historic specimens listed in table C (above). 19 These were the same specimens from which the gelatin model was developed. The coefficient of determination (R2) between the predicted and actual measurements was 0.33, a value we considered too low to be of use.
Similar modeling attempts using corrected raw dry short span, zero span, and wet short span (raw and corrected for paper thickness) data likewise did not give consistent results compared to the measured destructive values.
Discussion
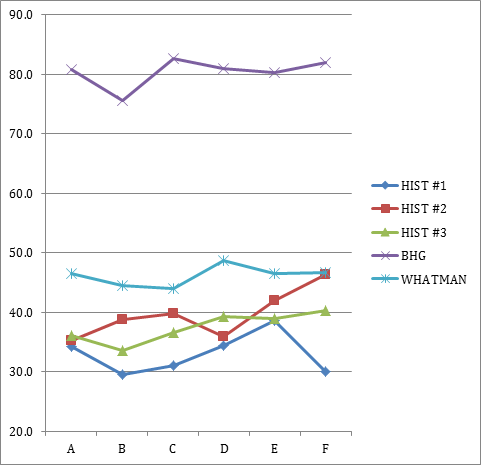
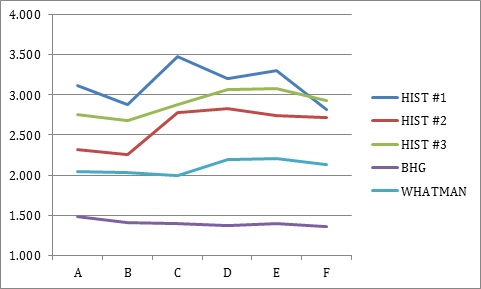
Treatment trends
The impact of treatments can be seen in plots 5, 6, 7, and 8 (above). While the Pulmac test has the advantage of generating relatively large numbers of tests from small amounts of paper, two of the three tests appear to have the disadvantage of requiring the removal or complete softening of any bonds associated with gelatin or otherwise. This is, in turn, would appear to confound any data gathered to monitor the role of gelatin in paper stability or treatment. However, the wet zero-span and wet short-span tests can reveal important information about fiber strength and fiber length, and both can be related to possible preservative effects of gelatin in the paper. Nevertheless, the DSS values are the most important in Experiment B, and in the earlier work as well, because they give a measure of paper strength with the gelatin still present. The Pulmac instrument and tests were utilized throughout the IMLS project because, despite their shortcomings, nine types of data were provided by one instrument, with relatively small amounts of paper destroyed in the process.20
The response of the historical papers to the treatments as measured by DSS in this work must not be considered the expected response of papers in need of these types of treatments because, as stated earlier, the specimens were selected for the large amount of print-free paper available rather than condition indicating the need for aqueous treatment. In plots 5, 6, 7, and 8, we found no common trends in the response of the specimens to the treatment protocols employed.
Prediction of paper strength
The resulting Experiment B data were most important in our efforts to evaluate the ability of US and UV-Vis-NIR measures to predict the eventual destructive tests.
The results in plots 9, 10, and 11 show little correlation for US specific stiffness against the three Pulmac values. Because of these results, we felt our decision to exclude the OPUS instrument from field testing 1,578 historical specimens was correct, and we are presently not optimistic about the use of US instrumentation for monitoring paper strength of individual items during treatment; however, the instrument remains available for continued related research. The situation is similar with our UV-Vis-NIR modeling efforts; however, it is important to emphasize that Tanja Trafela et al. have successfully employed NIR and mid-FT-IR (Fourier transform infrared) spectrometry in the reflectance mode to estimate tensile strength, pH, lignin and ash content, and even the date of paper samples.21
Color
Our US and UV-Vis-NIR efforts have not, thus far, yielded useful nondestructive strength-prediction methods, but we considered whether our color measurements revealed something about the stability of the paper specimens tested. A preliminary analysis of data on thirty-eight historical specimens suggests this may be the case. The thirty-eight specimens were from those listed in table C (excluding specimens L10R and L11R) and were in a range of condition from very poor to excellent. Data included results from our nondestructive color analyses and small sample destructive tests for DP (degree of polymerization), pH, ppm of calcium, weight percent gelatin, and Pulmac wet zero-span and dry short-span tensile strength.22 Correlations between the variables appear in the matrix below. The boldface red values do suggest that darker, redder, or yellower colors can be associated with lower pH, DP, and zero-span (fiber strength) values. This, of course, is in addition to their potentially negative impacts on image or type readability. As a result of these correlations, we plan to look again at the potential of predicting Pulmac wet zero-span (fiber strength) values with UV-Vis-NIR modeling.
D L* |
D a* |
D b* |
DP |
pH |
Gelatin |
Calcium |
Wet Z R |
Wet Z Corr |
Dry S R |
Dry S Corr |
|
D L* |
1 |
||||||||||
D a* |
-0.956 |
1 |
|||||||||
D b* |
-0.900 |
0.886 |
1 |
||||||||
DP |
0.752 |
-0.722 |
-0.800 |
1 |
|||||||
pH |
0.767 |
-0.733 |
-0.833 |
0.8919 |
1 |
||||||
Gelatin |
0.519 |
-0.486 |
-0.449 |
0.4996 |
0.487 |
1 |
|||||
Calcium |
0.524 |
-0.486 |
-0.472 |
0.5380 |
0.670 |
0.471 |
1 |
||||
Wet Z R |
0.755 |
-0.706 |
-0.739 |
0.8262 |
0.798 |
0.458 |
0.487 |
1 |
|||
Wet Z Corr |
0.728 |
-0.699 |
-0.741 |
0.8535 |
0.820 |
0.423 |
0.447 |
0.908 |
1 |
||
Dry S R |
0.645 |
-0.637 |
-0.555 |
0.6579 |
0.575 |
0.494 |
0.338 |
0.835 |
0.707 |
1 |
|
Dry S Corr |
0.586 |
-0.610 |
-0.512 |
0.6575 |
0.568 |
0.466 |
0.268 |
0.693 |
0.774 |
0.870 |
1 |
Conclusions
US methods require additional research if they are to be useful in estimating the gelatin content or strength of historical papers. Future work may show that the effects of long-term natural aging may alter paper properties in ways that complicate the more straightforward relationship between paper strength and US properties documented in modern machine-made papers. A careful study of the ways in which the US properties of gelatin-sized cotton, hemp, or flax papers respond to accelerated aging may reveal what changes occur and, possibly, how US instrumentation can be used more successfully in paper studies or conservation treatment work.
UV-Vis-NIR and mid-IR based techniques remain the most promising methods for predicting a wide range of historical paper properties, as Trafela et al. have demonstrated.23 Continued investigations of color measurements may reveal useful methods of estimating the physical and chemical properties of historical paper specimens.
Acknowledgments
Special thanks are due to Wavell Cowan. To begin with, Wavell invented the Pulmac Zero-Span 1000 tester. More relevant to the current work, he was extremely helpful in our efforts to establish a protocol for all the Pulmac testing, and he provided a devoted spreadsheet for tabulating our results. He donated three days of his time as a consultant to the project, training us in how to properly set up and use the instrument. His son Brent Cowan brought the instrument up to specification and provided a good deal of support and advice afterward. The instrument itself was provided for the research and remains on long-term loan to the UICB from International Paper in Ticonderoga, New York. Yasmeen Khan from the Library of Congress book conservation section provided many hours of consultation as well as hands-on direction during the aqueous treatment part of the experiment. Nancy Kraft, Gary Frost, and Kristin Baum graciously gave us full access to the UI Libraries conservation lab for the wet-treatment work, and Beth Stone assisted with enthusiasm.
Suppliers
Gelita photo bone gelatin; type 8039 lot 1
Gelita North America
PO Box 927
Sioux City, IA 51102
Sales line: (888) 443-5482
OPUS Instrument
http://www.sonisys.com/index_files/SoniSysInstruments.htm
APPENDIX
Raw Data for I Series Tab Tests
SAMPLE |
Raw Dry SS |
ICP1 C |
36.2 |
ICP1 CC |
44.9 |
ICP1 W |
22.8 |
ICP2 C |
28.4 |
ICP2 CC |
30.3 |
ICP2 W |
18.8 |
ICP3 C |
33.4 |
ICP3 CC |
36.8 |
ICP3 W |
21 |
ICP4 C |
39.3 |
ICP4 CC |
37.2 |
ICP4 W |
31.7 |
ICP5 C |
18.7 |
ICP5 CC |
22.6 |
ICP5 W |
17.7 |
ICP6 C |
31.2 |
ICP6 CC |
31.4 |
ICP6 W |
29.2 |
ICP7 C |
17.5 |
ICP7 CC |
21.4 |
ICP7 W |
17.3 |
ICP8 C |
33 |
ICP8 CC |
35 |
ICP8 W |
24.9 |
ICP9 C |
23.1 |
ICP9 CC |
22.5 |
ICP9 W |
18 |
ICP10 C |
28.1 |
ICP10 CC |
30.5 |
ICP10 W |
21.7 |
ICP11 C |
11.5 |
ICP11 CC |
12.1 |
ICP11 W |
13.5 |
ICP12 C |
18.6 |
ICP12 CC |
21.7 |
ICP12 W |
15.9 |
ICP13 C |
16.4 |
ICP13 CC |
17.7 |
ICP13 W |
12.9 |
ICP14 C |
23.3 |
ICP14 CC |
25.4 |
ICP14 W |
18.7 |
[1] Gary A. Baum and Charles C. Habeger, “On-line Estimates of Strength,” SMARTech Institute of Paper Chemistry 187 (June 1986), http://hdl.handle.net/1853/2687.
[2] Charles C. Habeger and G. A. Baum, “On-Line Measurement of Paper Mechanical Properties,” TAPPI Journal 69, no. 6 (1986): 106.
[3] K. G. Lantz and L. M. Chase, “On-Line Measurement and Control of Strength Properties,” TAPPI Journal 71, no. 2 (1988): 75.
[4] M. T. Lu, “On-Line Measurement of Strength Characteristics of a Moving Sheet,” TAPPI 58, no. 6 (1975): 80.
[5] Personal communication from Dr. Chris Tahk, then director of the Cooperstown Graduate Program in Conservation of Historic and Artistic Works, to T. Barrett, circa 1983.
[6] T. Barrett, “Early European Papers, Contemporary Conservation Papers: A Report on Research Undertaken from Fall 1984 through Fall 1987,” The Paper Conservator 13, no. 1 (1989): 1–108.
[7] T. Barrett, J. Waterhouse, and P. Lang, "Non-destructive Measurement of Gelatin and Calcium Content of European Book Papers: 1400–1800," in Erice Book Conservation Conference Postprints (Sicily, Italy: Erice Book Conservation Conference., 2000), 604–24.
[8] Derek J. Priest and A. Sule, "Measuring the Physical Properties of Paper within Books," in The Institute of Paper Conservation: Conference Papers Manchester 1992, ed. S. Fairbrass (London: Institute of Paper Conservation, 1992), 146–52.
[9] Barrett, “Early European Papers, Contemporary Conservation Papers.”
[10] Barrett et al., "Non-destructive Measurement of Gelatin and Calcium Content of European Book Papers: 1400–1800."
[11] John F. Waterhouse and Timothy D. Barrett, “The Aging Characteristics of European Handmade Papers: 1400–1800,” TAPPI Journal 74, no. 10 (1991): 207–12.
[12] The historical specimens used in this work are from a UI Center for the Book collection assembled by T. Barrett. A limited number of leaves, broken books, or library discards are included, and the specimens are intended for use in research, particularly any related to the development of non-destructive methods. Text areas are preserved, and only the blank margins utilized.
[13] See the following Technical Association of Pulp and Paper Industry (TAPPI) standard methods: TAPPI T 231 Zero Span Tensile Dry, TAPPI T 273 Zero Span Tensile Wet, TAPPI T 276 Degree of Fiber Bonding (short-span tensile dry), TAPPI T 279 Effective Length (short-span tensile wet). http://www.tappi.org/Contact-Us.aspx.
[14] Gelita photo bone gelatin (Type 8039, Lot 1).
[15] Personal communication: e-mail from Wavell Cowan to T. Barrett, February 3, 2011.
[16] Sylvia Albro, Julie L. Biggs, Claire Dekle, Mary Elizabeth Haude, Cyntia Karnes, and Yasmeen Khan, “Developing Guidelines for Iron-Gall Ink Treatment at the Library of Congress,” in Book and Paper Group Annual 27 (2008): 129–65.
[17] Book Conservation Catalog Wiki. American Institute for Conservation of Historic and Artistic Works. http://www.conservation-wiki.com/index.php?title=Book_Conservation_Catalog#Section_5_-_Conservation_Treatment.
[18] Dirk Lichtblau, Matija Strlič, Tanja Trafela, Jana Kolar, and Manfred Anders, “Determination of Mechanical Properties of Historical Paper Based on NIR Spectroscopy and Chemometrics—A New Instrument,” Applied Physics A 92 (2008): 191–95.
[19] Specimen D3 was excluded, as its source was the same as that of specimen 3 in Experiment B.
[20] Given the availability of at least three tabs, three raw and three corrected values are added to the Pulmac FS, L, and B numbers for a total of nine types of data from one paper.
[21] Tanja Trafela, M. Strlič, J. Kolar, D. A. Lichtblau, M. Anders, D. P. Mencigar, and B. Pihlar, “Nondestructive Analysis and Dating of Historical Paper Based on IR Spectroscopy and Chemometric Data Evaluation,” Analytical Chemistry 79, no. 16 (2007): 6319–23.
[22] Methods used for small sample destructive tests for DP (degree of polymerization), pH, ppm calcium, and weight percent gelatin are described in Catherine H. Stephens, T. Barrett, P. Whitmore, J. Wade, J. Mazurek and M. Schilling, “Composition and Condition of Naturally Aged Papers,” Journal of the American Institute for Conservation 47 (2008): 201–15.
[23] Tanja Trafela et al., “Nondestructive Analysis and Dating of Historical Paper Based on IR Spectroscopy and Chemometric Data Evaluation.”