
Procedures: Analyses of 1,578 Historical Specimens
The following procedure was used to process all specimens:
- Log in item with the following information: a unique Institute of Museum and Library Sciences (IMLS) number; institutional catalogue information including call number, title, author, printer (if known), place of publication or (in the case of manuscript materials) writing; estimate of binding as contemporary or late; date (of publication or writing); “soft date,”1 yes or no? (Y/N); type of specimen (printed leaf or book, MS leaf or book, art print, blank leaf); significant foxing (Y/N); machine made (Y/N).
- Indicate “same book, different papers” phenomenon (Y/N). (See “Same book, different papers” (SBDP) subset under DISCUSSION section.)
- Select a representative leaf for testing. (If markedly different papers were found in the same book, we assigned each a unique IMLS number and treated each as a separate specimen.)
- Measure leaf dimensions in centimeters.
- Measure thickness in millimeters of the specimen and, in books, the thickness of ten leaves (the leaf analyzed and the following nine leaves).
- Assign an M&W paper-quality grade as discussed above.
- Indicate “Frost” grade of A, B, or C if inspected by Gary Frost. (See Frost grade A “ornament” plots subset under DISCUSSION, Nonchronological Plots below.)
- Photograph the specimen tested.
- Execute XRF tests at five locations (see fig. 11, below).
- Execute two UV-Vis-NIR tests at each of the five locations used for the XRF analyses.
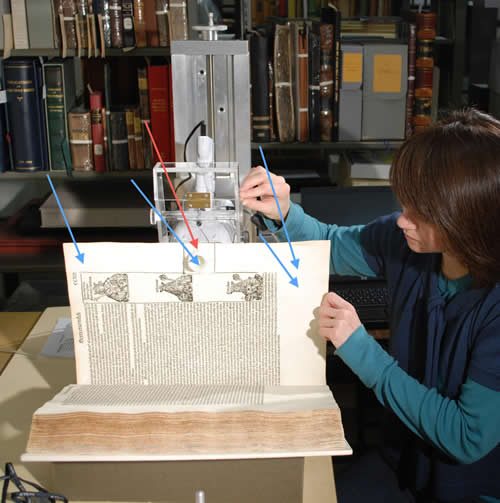
We decided to do analyses at five locations on each specimen. One 120-second XRF scan was done at the center of the fore edge of the leaf as close to the edge as possible (red arrow). This was followed by four 30-second XRF scans in the margins (blue arrows): one midway between the fore edge center and the printed area, one midway between the upper right-hand corner and the printed area, one likewise at the lower right-hand corner, and finally one in the lower margin, midway between the edge and the printed area as far from the lower right corner as the cup holder assembly would permit (about 5 cm). The four “interior” margin analyses were later combined into a single “interior” value for a total of 120 seconds of sampling time, which could then be compared to the single 120-second analysis at the very edge of the leaf. This amalgamation was done to investigate whether airborne components such as sulfur accumulate at the edge of the leaf relative to the interior of the sheet. For each of the ten UV-Vis-NIR tests, the instrument was set to gather fifty spectra, resulting in a total of five hundred spectra for each specimen after running two tests approximately 1 cm apart at each of the five locations (blue and red arrows).
[1]“Soft dates” were assigned to thirty specimens for which the institutional citation was approximate, such as “1350–1450” or “late 14th c.” This was done only to aid in plotting. In all cases, the assigned soft dates leaned toward the late part of the period cited. In subsequent plotting “Date” was changed to “Year.”